Basic 2D plotting (line, scatter, and bar) is not always enough to help professionals connect to or communicate with data. Therefore, Matplotlib's mplot3d toolkit comes with various other 3D plotting systems to make the data view more accurate so that professionals can take a closer look at the data plot from different angles. This tutorial will explain the different types of three-dimensional plotting systems in Matplotlib, such as 3D Surface Plot, 3D Wireframe Plot, 3D Contour Plot, and 3D Möbius Strip Plot.
Plotting 3D Surface Plot
The surface graph helps to illustrate a set of 3-dimensional data spread over surfaces as a filled mesh. This graph becomes useful when there is a need to show the optimal combination or transformation between two data sets. Professionals use it to see changes in the climate or ecosystem. The ax.plot_surface() function generates Plotting surface graph.
Example:
import matplotlib.pyplot as pyplot
import numpy as np
from mpl_toolkits import mplot3d

x = np.outer(np.linspace(-2, 4, 8), np.ones(8))
y = x.copy().T
z = np.cos(x ** 3 + y ** 4)

fig = pyplot.figure(figsize = (6, 6))

ax = pyplot.axes(projection = '3d')
ax.plot_surface(x, y, z, cmap ='viridis', edgecolor ='orange')
ax.set_title('PLOT with Yellow as least dense altitude and Black as denser altitude')

# Print the chart
pyplot.show()
Program Output:

Plotting 3D Wireframe Plot
These are 3D plots that take a grid of values and project it onto the three-dimensional surface. The resulting generated graphs become three-dimensional, which is easy to visualize. In the wireframe plot, the plotted surface does not remain filled. They are simply wavey lines that form the grid-like structure showing the ups and downs of data. Professionals also use such graphs to see changes in climate or ecosystem. The ax.plot_wireframe() function generates wireframe graph.
Example:
import matplotlib.pyplot as pyplot
import numpy as np
from mpl_toolkits import mplot3d

# function to calculate z-axis
def wavey(x, y):
       return np.sin(np.sqrt(x ** 2 + y ** 2))

# creating the values for x and y axis
x = np.linspace(-1, 2, 10)
y = np.linspace(-1, 2, 10)
x, y = np.meshgrid(x, y)
z = wavey(x, y)

fig = pyplot.figure(figsize = (6, 6))

ax = pyplot.axes(projection = '3d')
ax.plot_wireframe(x, y, z, color = 'red')
ax.set_title('Matplotlib 3D Wireframe Plot Example');
ax.view_init(50, 60)

# Print the chart
pyplot.show()
Program Output:

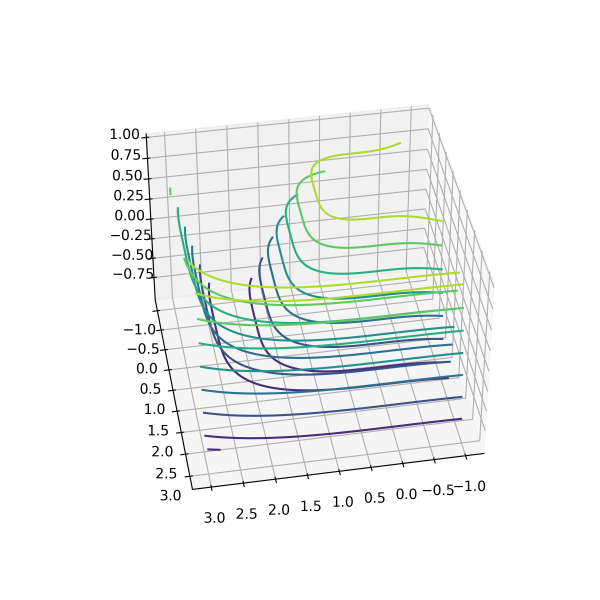
Plotting 3D Contour Plot
The contour graph takes multiple data inputs in 2-dimensional regular grids and evaluates the Z data at every point. Most geographical operations and research data require plotting their visualizations through Contour graphs. The ax.contour() function generates contour graph.
Example:
import matplotlib.pyplot as pyplot
import numpy as np
from mpl_toolkits import mplot3d

# function to calculate z-axis
def f(x, y):
    return np.cos(np.sqrt(x ** 3 + y ** 4))

# generating the data points for x and y axis
x = np.linspace(-1, 3, 100)
y = np.linspace(-1, 3, 100)
x, y = np.meshgrid(x, y)

# Calculate z-axis
z = f(x, y)

fig = pyplot.figure(figsize = (6, 6))

ax = pyplot.axes(projection ='3d')
ax.contour3D(x, y, z)
ax.view_init(40, 80)

# Print the chart
pyplot.show()
Program Output:
Plotting 3D Möbius Strip Plot
Möbius Strip Graph visualization looks like a twisted cylindrical shape graph formation. It acts as one-sided textures without boundaries. For creating the Möbius strip, think about it as a parameterization; it is a 2-dimensional strip plotted in a three-dimensional space. The ax.plot_trisurf() function generates Möbius strip graph.
Example:
import matplotlib.pyplot as pyplot
import numpy as np
from mpl_toolkits.mplot3d import Axes3D
import matplotlib.tri as mtri

fig = pyplot.figure(figsize = (6, 6))

ax = pyplot.axes(projection = '3d')

x = np.linspace(0, 2.5*np.pi, endpoint = True, num = 60)
y = np.linspace(-1, 1, endpoint = True, num = 10)
x, y = np.meshgrid(x, y) # Generating using a 3D meshgrid function
x = x.flatten() #g representing a one-dimensional array of
y = y.flatten() #s representing another one-dimensional array

a = (1 + 0.5 * s * np.cos(g/2.0)) * np.cos(g)
b = (1 + 0.5 * s * np.sin(g/2.0)) * np.sin(g)
c = 0.5 * s * np.sin(g/2.0)

tri = mtri.Triangulation(x, y)
ax.plot_trisurf(a, b, c, cmap = "cool", triangles = tri.triangles)
ax.set_xlim(-1.1, 1.1)
ax.set_ylim(-1.1, 1.1)
ax.set_zlim(-1, 1)

# Print the chart
pyplot.show()
Program Output:
