Often data science professionals need to present several plots mixed under one image to see the difference between past and current data changes. Such discrimination provides a better insight into a particular concept or circumstance. That is where Matplotlib comes up with the concept of multiple subplots. This tutorial teaches you how to create Multiple Subplots using Matplotlib.
What Is Matplotlib Multiple Subplots?
Matplotlib Subplot in the Matplotlib library is a way where data analysts can render multiple sub-plots under one plot. It helps in differentiating and comparing various views of data together side by side. Subplots are one of the most essential but fundamental concepts that need to be understood when plotting multiple graphs or figures in a single plot. In Matplotlib, we have the subplot() and subplots() functions in the pyplot module. The syntax of this built-in method looks something like this:
Syntax:
matplotlib.pyplot.subplot(nrows, ncols, index)and
matplotlib.pyplot.subplots(nrows, ncols, sharex = False, sharey = False, squeeze = True, subplot_kw = None, gridspec_kw = None, **kwargs)where,
- nrows and ncols determine the number of rows and columns in the subplot.
- sharex and sharey determine the sharing properties associated with the x-axis and y-axis.
- squeeze is an optional parameter with a default value of "True". It normally contains Boolean values.
- subplot_kw has the "dict" with keywords provided to the add subplot method, which is used to create each subplot.
- gridspec_kw helps in creating the grid where multiple plots will be located.
There are two major ways of plotting Subplot through Matplotlib:
- The Stacked Plots
- The Grid Plots
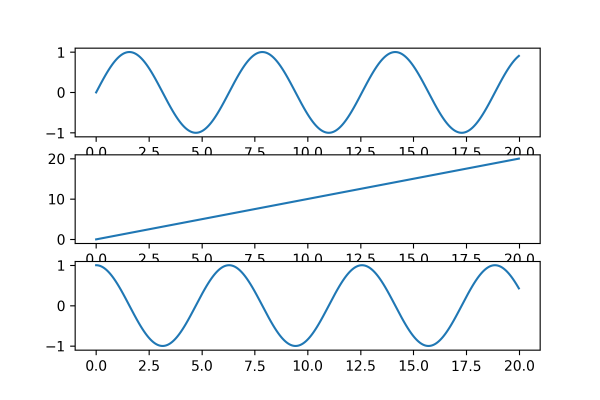
Stacked Plots
In a stacked plot, multiple plots are generated one after the other, like a "stack data structure".
Example:
import matplotlib.pyplot as plt
import numpy as np

x = np.arange(0, 20, 0.02)

plt.subplot(3, 1, 1)
plt.plot(x, np.sin(x))

plt.subplot(3, 1, 2)
plt.plot(x, x)

plt.subplot(3, 1, 3)
plt.plot(x, np.cos(x))

# Print the chart
plt.show()
Program Output:
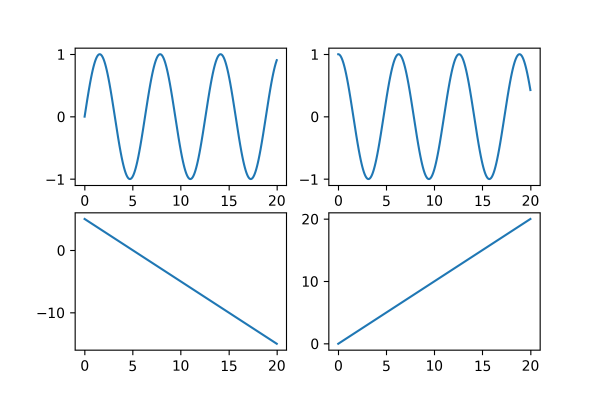
Grid Plots
In Grid Plots, multiple plots get generated like grids or tiles one after the other in box-shaped structures. For example, If a data analyst wants to create four multiplot, they have to make a 2×2 grid, which means there will be n_rows = 2 and n_cols = 2. Here each image will get identified by the index again in the form of a row-major order. If a data analyst wants to create a multiplot with three plots, they should have to make three consecutive grids vertically stand one after the other from left to right.
Example:
import matplotlib.pyplot as plt
import numpy as np

g = np.arange(0, 20, 0.02)

plt.subplot(2, 2, 1)
plt.plot(g, np.sin(g))

plt.subplot(2, 2, 2)
plt.plot(g, np.cos(g))

plt.subplot(2, 2, 3)
plt.plot(g, 5-g)

plt.subplot(2, 2, 4)
plt.plot(g, g)

# Print the chart
plt.show()
Program Output:
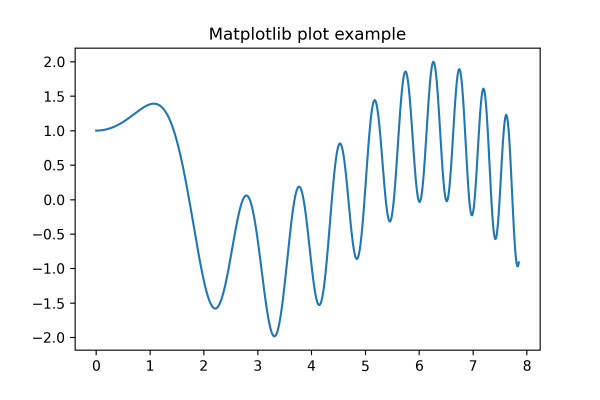
Example of a Single Plot Using the subplots() Function
import numpy as np
import matplotlib.pyplot as plt

x = np.linspace(0, 2.5*np.pi, 500)
y = np.sin(g**2) + np.cos(g)

fig, ax = plt.subplots()

ax.plot(x, y)
ax.set_title('Matplotlib plot example')

# Print the chart
plt.show()
Program Output:
Example of Multiple Plots Using the subplots() Function
import numpy as np
import matplotlib.pyplot as plt
plt.figure(figsize=(6, 4))

def f(g):
        return np.sin(g) - g * np.cos(g)

def fp(g):
        return g * np.sin(g)

G = np.arange(-5, 25.0, 0.025)
fig, ax = plt.subplots(2, sharex = 'col', sharey = 'row')

ax[0].plot(G, f(G), 'yo', G, f(G), 'r')
ax[0].set(title=' Multiplots using subplots() ')

ax[1].plot(G, fp(G), 'co', G, fp(G), 'b')
ax[1].set(xlabel='Values at X', ylabel='Values at Y', title='Derivative Function through f')

# Print the chart
plt.show()
Program Output:

Adding a Grid to a Specific or Both Subplots
Data science professionals can also create grids to get better measurements and insights into the data and better isolate the situation. These internal grids are virtual lines that one can create using Matplotlib's grid() method.
Example:
import numpy as np
import matplotlib.pyplot as plt

plt.figure(figsize=(6, 4))

def f(g):
        return np.sin(g) - g * np.cos(g)

def fp(g):
        return g * np.sin(g)

G = np.arange(-5, 25.0, 0.025)
fig, ax = plt.subplots(2, sharex = 'col', sharey = 'row')

ax[0].plot(G, f(G), 'yo', G, f(G), 'r')
ax[0].set(title=' Multiplots using subplots() ')

ax[1].plot(G, fp(G), 'co', G, fp(G), 'b')
ax[1].set(xlabel='Values at X', ylabel='Values at Y', title='Derivative Function through f')

ax[0].grid()
ax[1].grid()

# Print the chart
plt.show()
Program Output:
