Matplotlib got originated keeping in mind 2-dimensional plotting. But when version 1.0 was about to be released, the 3-dimensional utilities got developed on top of the 2-dimensional ones. Thus, Matplotlib has another sub-module that has the potential to render the 3D implementation of data available today. This tutorial will give you a complete understanding on 3D plotting using Matplotlib.
Matplotlib 3D Plotting in Data Visualization
Data visualization is a specialized vertical of data science where many libraries were developed using Python. Among these, Matplotlib got the most popular choice for rendering data visualizations to get a better insight. Initially, Matplotlib was used to create 2D plotting charts like line charts, bar charts, histograms, scatter plots, pie plots, etc. Matplotlib creators decided to extend its capabilities to deliver 3D plotting modules also. Three-dimensional plots can be used by importing the mplot3d toolkit; It comes pre-installed with Matplotlib installation:
Syntax:
from mpl_toolkits import mplot3d
Generate a Blank 3D Plot
An empty 3D plot can be created by passing the keyword projection='3D' to the axis creation function:
Example:
import matplotlib.pyplot as pyplot
import numpy as np
from mpl_toolkits import mplot3d

fig = pyplot.figure(figsize = (6, 6))
ax = pyplot.axes(projection = '3d')

# Print the chart
pyplot.show()
Program Output:

3D Lines Using mplot3d and Matplotlib
To create 3D lines, you must use the plot3D() function, wherein you need to place the three parameters of the three axes.
Example:
import matplotlib.pyplot as pyplot
import numpy as np
from mpl_toolkits import mplot3d

fig = pyplot.figure(figsize = (6, 6))
ax = pyplot.axes(projection = '3d')

#Mentioning all the three different axes.
z = np.linspace(0, 2, 1000)
x = z * np.sin(40 * z)
y = z * np.cos(40 * z)

ax.plot3D(x, y, z, 'blue')
ax.set_title('3D plotting of line chart')

# Print the chart
pyplot.show()
Program Output:

3D Points Using mplot3d and Matplotlib
Also, you can create the same figure using points. That becomes possible if you use the scatter() function keeping the axes(projection = '3d').
Example:
import matplotlib.pyplot as pyplot
import numpy as np
from mpl_toolkits import mplot3d

fig = pyplot.figure(figsize = (8, 8))
ax = pyplot.axes(projection = '3d')

#Mentioning all the three different axes.
z = np.linspace(0, 2, 500)
x = z * np.sin(40 * z)
y = z * np.cos(40 * z)

ax.scatter(x, y, z, c='Red')
ax.set_title('3D plotting of scatter chart')

# Print the chart
pyplot.show()
Program Output:

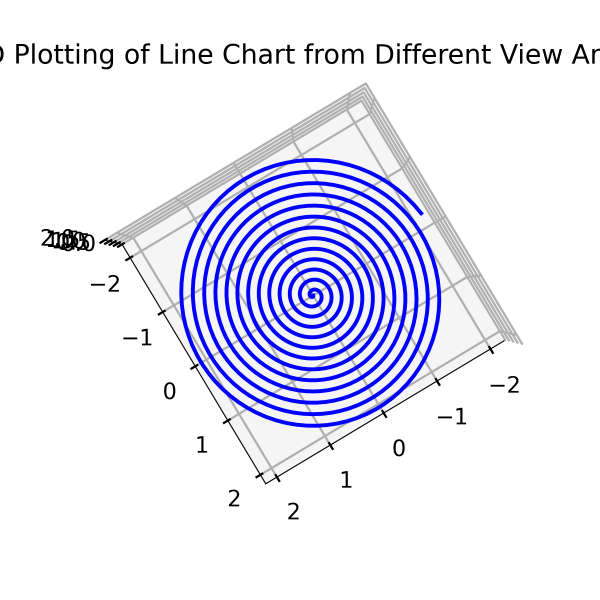
Change Camera Angle of 3D Plot
The 3D plot camera perspective can be changed to see the graph from different views, sides, and angles. It is good to display data from a different perspective for better understanding. It is executed using the view_init() function.
Syntax:
view_init(elev, azim)Where 'elev' helps store the elevation angle of the z-plane, and 'azim' helps store the combined angle in the x, y plane.
Example:
Here we are taking the example of the spiral to understand the situation better:
Example:
import matplotlib.pyplot as pyplot
import numpy as np
from mpl_toolkits import mplot3d

fig = pyplot.figure(figsize = (6, 6))
ax = pyplot.axes(projection = '3d')

#Mentioning all the three different axes.
z = np.linspace(0, 2, 1000)
x = z * np.sin(40 * z)
y = z * np.cos(40 * z)

#Plot in 3D
ax.plot3D(x, y, z,'blue')
ax.view_init(90, 60)
ax.set_title('3D Plotting of Line Chart from Different View Angle')

# Print the chart
pyplot.show()
Program Output:
If we change the ax.view_init(140, 30), i.e., z value, to 140, it will rotate upside down. The plot will look like this:
Program Output:
