Fetching stock data is essential for financial analysis, algorithmic trading, and stock performance tracking. Yahoo Finance provides a reliable and easy-to-use data retrieval mechanism through the yfinance Python library, simplifying the process of fetching historical stock information. This tutorial demonstrates how to fetch and analyze stock data, empowering you to build financial models, track performance, and conduct analysis.
Setting Up the Environment
Before diving into the code, ensure you have the necessary Python libraries installed:
pip install yfinance pandas matplotlib
These libraries help retrieve data, perform data manipulation, and create visualizations.
Fetching Stock Data
Here's a Python script to fetch historical stock data:
import yfinance as yf
import pandas as pd
from datetime import datetime

# Fetch stock data from Yahoo Finance
def get_stock_data(stock_symbol, period='1mo'):
    """
    Fetch historical stock data for a given stock symbol and period.

    :param stock_symbol: The ticker symbol of the stock (e.g., 'TATAMOTORS.NS').
    :param period: The period for which to fetch data (default is '1mo').
    :return: A DataFrame containing Date, Open, and Close price.
    """
    try:
        # Fetch data using yfinance
        stock_data = yf.download(stock_symbol, period=period, interval='1d')
        if stock_data.empty:
            raise ValueError(f"No data found for {stock_symbol}.")
    except Exception as e:
        print(f"Error fetching data for {stock_symbol}: {e}")
        return pd.DataFrame()

    # Reset index to include Date as a column
    stock_data.reset_index(inplace=True)

    # Remove timezone information from 'Date' column if it exists
    if 'Date' in stock_data.columns and pd.api.types.is_datetime64_any_dtype(stock_data['Date']) and stock_data['Date'].dt.tz is not None:
        stock_data['Date'] = stock_data['Date'].dt.tz_localize(None)

    # Define required columns
    needed_cols = [('Date', ''), ('Open', stock_symbol), ('Close', stock_symbol)]
    present_cols = [col for col in needed_cols if col in stock_data.columns]

    if len(present_cols) < 3:
        print("Warning: Not all required columns are available.")
        return stock_data[present_cols]

    # Return a DataFrame with only the required columns
    return stock_data[[('Date', ''), ('Open', stock_symbol), ('Close', stock_symbol)]]


# Main function
def main():
    """
    Main function to interact with the user, fetch stock data,
    and display/save it in a readable format.
    """
    # Input prompts for stock symbol and period
    stock_symbol = input("Enter stock symbol (e.g., 'TATAMOTORS.NS'): ").strip()
    period = input("Enter period (e.g., '1mo', '6mo', '1y'): ").strip()

    # Validate period input
    valid_periods = ['1d', '5d', '1mo', '3mo', '6mo', '1y', '2y', '5y', '10y', 'ytd', 'max']
    if period not in valid_periods:
        print(f"Invalid period. Please choose from: {', '.join(valid_periods)}")
        return

    print(f"\nFetching stock data for {stock_symbol} for the last {period}...\n")
    stock_data = get_stock_data(stock_symbol, period=period)

    # Handle empty DataFrame
    if stock_data.empty:
        print(f"No data available for {stock_symbol}. Ensure the stock symbol is correct and try again.")
        return

    # Rename columns for simplicity
    stock_data.columns = ['Date', 'Open', 'Close']

    # Display the stock data
    pd.set_option("display.max_rows", None)
    pd.set_option("display.max_columns", None)
    print("\n=== Full Historical Stock Data ===\n")
    print(stock_data.to_string(index=False, col_space=15))
    print("\n==================================\n")

    # Save the data to a CSV file
    current_date = datetime.now().strftime("%Y-%m-%d")
    file_name = f"{stock_symbol.replace('.', '-')}_{period}_{current_date}.csv"
    stock_data.to_csv(file_name, index=False)
    print(f"Data saved to '{file_name}'")


# Run the main function
if __name__ == "__main__":
    main()
Example Output:
For the stock symbol TATAMOTORS.NS over the last 1 month:
Enter stock symbol (e.g., 'TATAMOTORS.NS'): TATAMOTORS.NS
Enter period (e.g., '1mo', '6mo', '1y'): 1mo

Fetching stock data for TATAMOTORS.NS for the last 1mo...

[*********************100%***********************]  1 of 1 completed

=== Full Historical Stock Data ===

           Date            Open           Close
     2024-11-05      821.500000      835.650024
     2024-11-06      843.900024      839.700012
     2024-11-07      841.000000      819.750000
     2024-11-08      821.950012      805.450012
     2024-11-11      801.000000      804.700012
     2024-11-12      806.000000      784.849976
     2024-11-13      787.000000      786.250000
     2024-11-14      786.599976      774.299988
     2024-11-18      778.000000      771.900024
     2024-11-19      771.900024      783.200012
     2024-11-21      784.950012      773.849976
     2024-11-22      775.000000      791.000000
     2024-11-25      808.049988      796.599976
     2024-11-26      797.150024      783.000000
     2024-11-27      785.049988      783.950012
     2024-11-28      783.000000      779.450012
     2024-11-29      779.500000      786.450012
     2024-12-02      787.299988      790.049988
     2024-12-03      795.000000      801.250000
     2024-12-04      805.000000      788.099976
     2024-12-05      793.000000      792.549988

==================================

Data saved to 'TATAMOTORS-NS_1mo_2024-12-05.csv'
Visualizing Stock Trends
Use the matplotlib library to visualize stock data, particularly the closing prices:
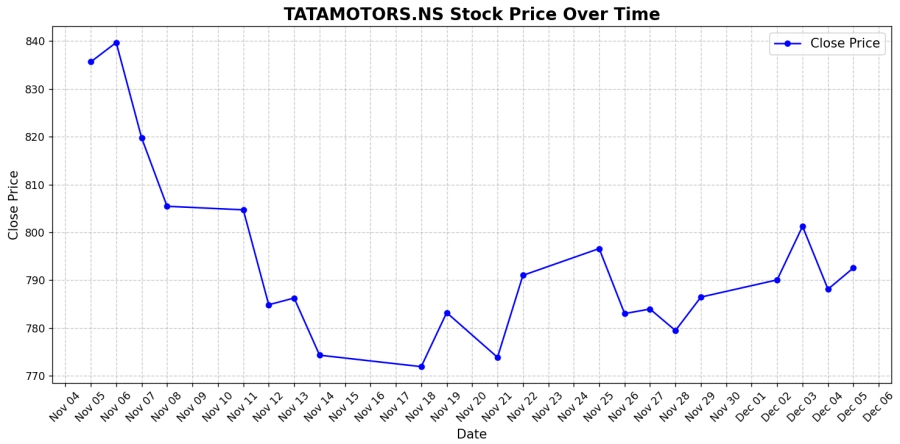
def plot_stock_data(stock_data, stock_symbol):
    """
    Plots the stock's closing price over time with all dates displayed on the x-axis.

    Parameters:
        stock_data (pd.DataFrame): DataFrame containing stock data with 'Date' and 'Close' columns.
        stock_symbol (str): The ticker symbol of the stock.
    """
    # Convert Date column to datetime if not already
    if not pd.api.types.is_datetime64_any_dtype(stock_data['Date']):
        stock_data['Date'] = pd.to_datetime(stock_data['Date'])

    plt.figure(figsize=(12, 6))  # Larger figure for better visibility
    plt.plot(
        stock_data['Date'],
        stock_data['Close'],
        label='Close Price',
        marker='o',
        linestyle='-',
        color='blue',
        markersize=5
    )

    # Setting up the x-axis to display all dates
    plt.gca().xaxis.set_major_locator(mdates.DayLocator())  # Major ticks for every day
    plt.gca().xaxis.set_major_formatter(mdates.DateFormatter('%b %d'))  # Format date as 'Month Day'

    plt.title(f'{stock_symbol} Stock Price Over Time', fontsize=16, fontweight='bold')
    plt.xlabel('Date', fontsize=12)
    plt.ylabel('Close Price', fontsize=12)

    # Customizing grid for better visual clarity
    plt.grid(visible=True, linestyle='--', alpha=0.7)
    plt.legend(fontsize=12)
    plt.xticks(rotation=45, fontsize=10)  # Rotate and resize x-axis labels for better readability
    plt.yticks(fontsize=10)

    # Show plot with tight layout for better spacing
    plt.tight_layout()
    plt.show()
Call this function after fetching the data:
plot_stock_data(stock_data, stock_symbol)Output:
Customization Options
- Adjusting Columns: Include High, Low, and Volume data for detailed analysis:
stock_data[['Date', 'Open', 'High', 'Low', 'Close', 'Volume']] - Change Timeframe: Modify the
periodparameter (e.g.,1d,5y) to analyze different time intervals. - Additional Stock Symbols: Use tickers like
AAPL,MSFT,TSLA, or^GSPCfor indices like the S&P 500.
Conclusion
This tutorial introduced you to fetching and analyzing stock data using Yahoo Finance's yfinance library. By following these steps, you can customize your Python scripts for various financial analyses, create visualizations, and build predictive models. Try experimenting with different stock symbols, intervals, and data columns to broaden your understanding and capabilities.