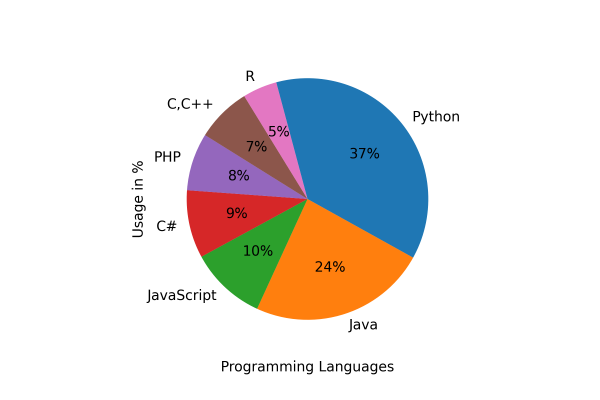
This Python program contains a simple program to generate pie charts using the Matplotlib Python library. Matplotlib Python has an extensive library for creating stable, animated, and interactive data visualizations.
In this Python program, we have used the popularity data of different programming languages and displayed it as a pie chart using the Matplotlib Python library.
Example:
An example of a Python Matplotlib Pie Chart:
import matplotlib.pyplot as pyplot

# Manual data setup
labels = ('Python', 'Java', 'JavaScript', 'C#', 'PHP', 'C,C++', 'R')
sizes = [29.9, 19.1, 8.2, 7.3, 6.2, 5.9, 3.7]

# bar chart setup
pyplot.pie(sizes, labels=labels, autopct='%1.f%%', counterclock=False, startangle=105)

# layout configuration
pyplot.ylabel('Usage in %')
pyplot.xlabel('Programming Languages')

# Save the chart file
#pyplot.savefig('matplotlib_pie_chart01.png', dpi=300)

# Print the chart
pyplot.show()
Program Output:

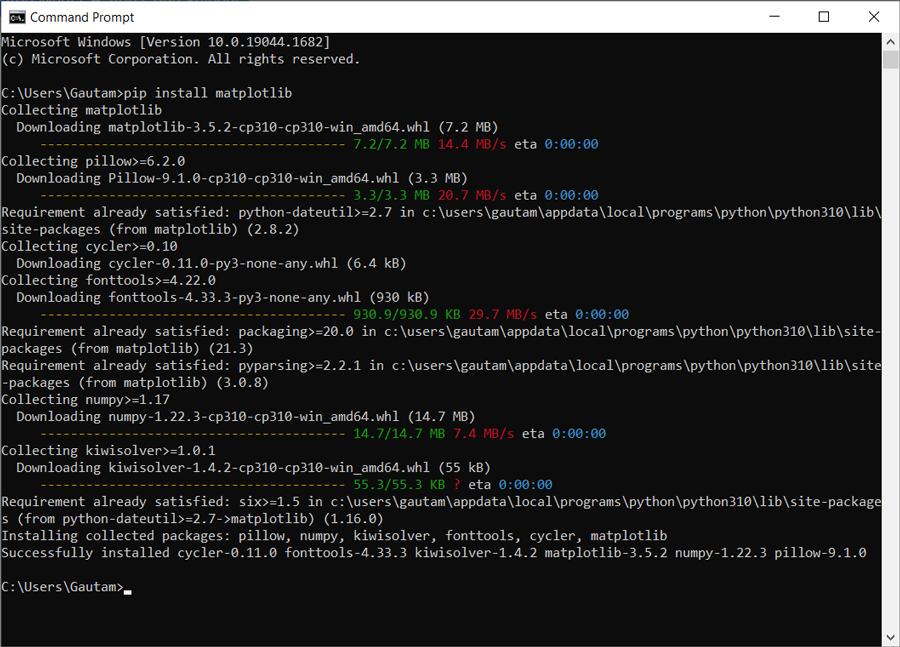
Install Matplotlib
The Matplotlib Python library is installed using pip (package manager for Python). The following command installs the Matplotlib package:
pip install matplotlib
